
Curious about what is going on in the Phoenix real estate market? This post and video will give you some insight!
Here at The Joe Janus Real Estate we are paid subscribers of the Cromford Report and utilize it to stay on top of the Phoenix real estate market. Why do you ask? Simple really, Michael Orr. He is the Director of the Center for Real Estate Theory and Practice at ASU and the creator of The Cromford Report. In our minds, he is a genius when it comes to real estate data and providing insight into the market!
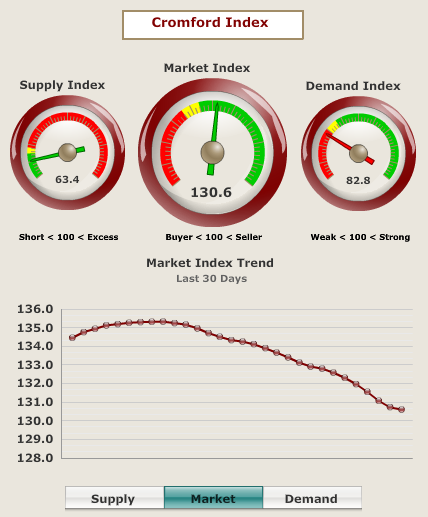
One of the biggest indicators we track is the Cromford Market Index™. As defined on cromfordreport.com the Cromford Market Index™ (CMI) is a value that provides a short term forecast for the balance of the market. It is derived from the trends in pending, active and sold listings compared with historical data over the previous four years. Values below 100 indicate a buyer’s market, while values above 100 indicate a seller’s market. A value of 100 indicates a balanced market.
The CMI for Phoenix as of February 18th 2016 is 130.6, which indicates that we are in a market that is tilted towards favoring sellers. However, the 30 day trend line shows that we are trending towards a balanced market and sellers are beginning to lose their advantage.
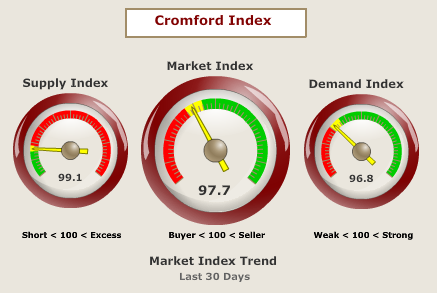
 Scottsdale’s CMI, supply and demand indicators show they are in a “normal/balanced” market.
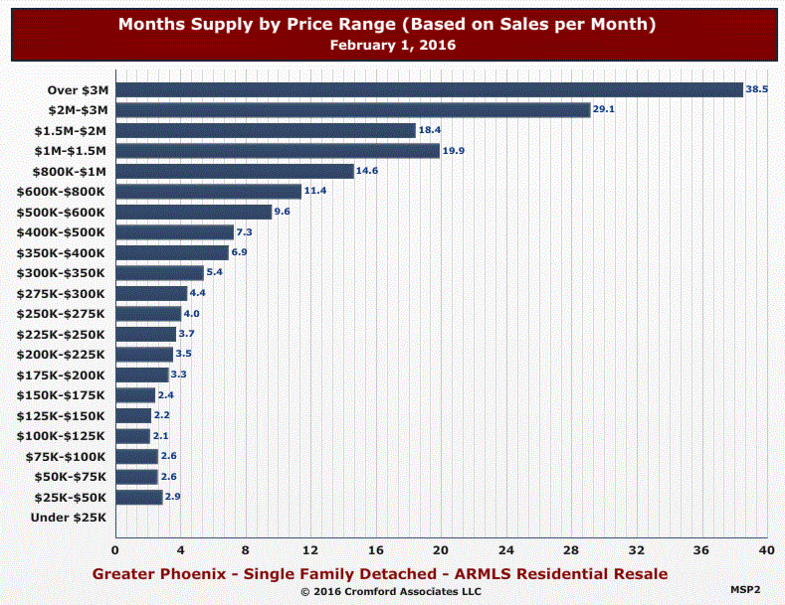
 When looking at the Phoenix real estate market (or any real estate market for that matter) we would be remiss in pointing out that there are submarkets. This becomes apparent when we look at different price ranges. The months of supply for Phoenix homes that are $300,000 and below range between only 2.1 and 4.4 months! Months supply means that it would take that many months to sell all that current inventory with no other new listings coming to the market. As the price of the home goes up, you are looking at more supply and a longer time for those to sell.
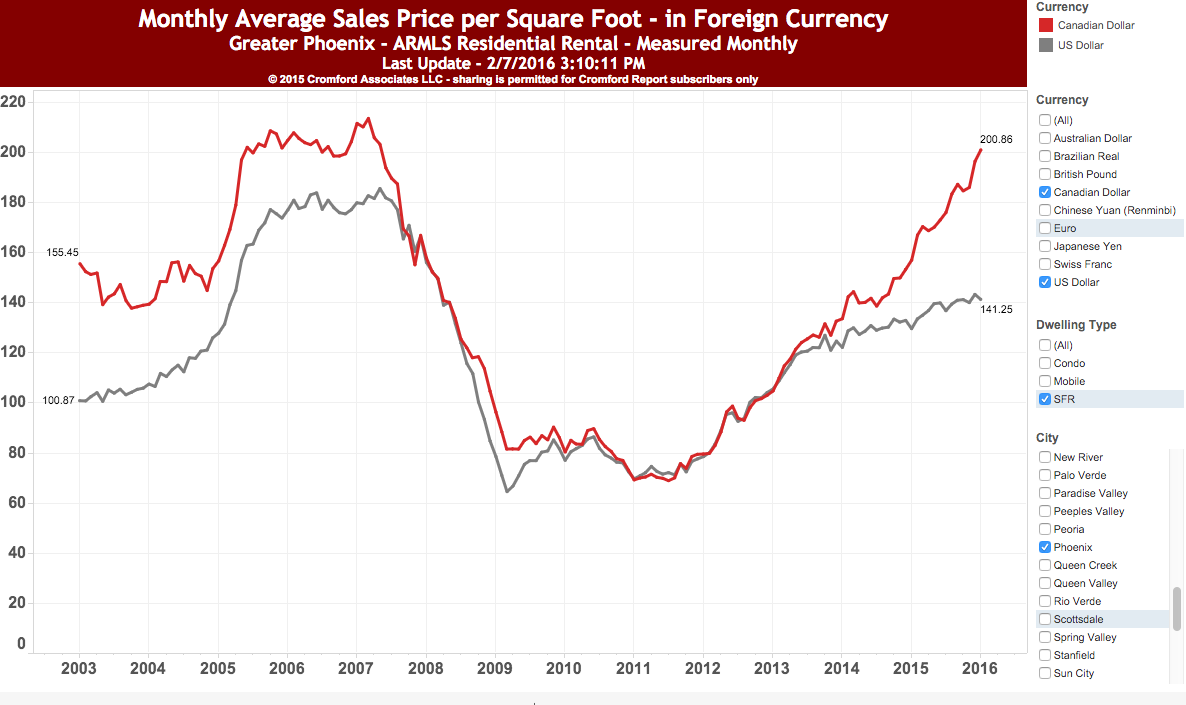
 Finally, if you are Canadian and you own a home in Phoenix area that you’ve been thinking about selling, now is the time to get off the fence and sell. The exchange rate is in your favor to do so. The Cromford Report also compares the price per square foot based on foreign currency. As you can see in the graph below (and in the video) the gap between price per square foot in Canadian Dollars vs. the U.S. Dollar has increased quite a bit. This is also evidenced by a decrease in the number of Canadian buyers in the Phoenix area because homes have become more expensive for them to purchase.
We hope that you found this information to be helpful! Please let us know if you have any questions or suggestions on what else you would like to see and hear about!
602.620.6267 – info@janusgrouprealestateaz.com

Leave a Reply